Author Archives: freeandclear

Mortgage Assistance Options for Borrowers Impacted by COVID-19

Fannie Mae and Freddie Mac, the organizations that own the majority of mortgages in the United States and set mortgage industry guidelines that most lenders follow, announced a number of assistance measures for borrowers negatively impacted by the COVID-19 crisis. A similar set of policies apply to FHA, VA and USDA loans and many national and regional lenders have adopted their own mortgage assistance programs.

If you have experienced a job loss, layoff or pay reduction due to the current health crisis and are struggling to pay your mortgage, these programs may offer financial relief and help you stay in your home.

The response to COVID-19 by regulators, agencies and certain lenders represents a stark contrast to the Great Recession, which saw millions of borrowers lose their homes to foreclosure. The initiatives outlined below are all designed to help keep people in their home. Plus, these programs are free and borrowers are not charged any fees, penalties or additional interest in most cases.

Below, we summarize the homeowner relief programs Fannie Mae, Freddie Mac, the FHA, VA, USDA and other lenders are offering and answer key questions you may have.

Overview of COVID-19 Mortgage Assistance Options

  • Foreclosures and mortgage default-related evictions are suspended as of March 13, 2020 for Fannie Mae and Freddie Mac-owned loans, as of March 18, 2020 for FHA loans and as of March 19 for USDA loans. The foreclosure moratorium has been extended multiple times due to the pandemic and now runs through July 31, 2021.

This means that you have a reprieve if you are at risk of losing your home due to foreclosure for any reason.  Please note that this guideline may not apply to vacant or abandoned properties.

  • Borrowers financially affected by COVID-19 are eligible for mortgage forbearance for up to 18 months. The maximum forbearance period was originally 12 months but was extended to 18 months in June 2021.

Forbearance means that your mortgage payments are suspended or in some cases reduced, although interest may continue to accrue on your loan, so you should confirm this point with Fannie Mae, Freddie Mac, the FHA, VA, USDA or your mortgage servicer.  Borrowers that participate in a forbearance program are not subject to late fees or penalties and any missed or late payments are not reported to the credit bureaus so your credit score should not be negatively affected.

We should highlight that in most cases you are not required to repay the amount of the forbearance in a lump sum when you resume your mortgage payments. Below we review your options for repaying the missed payments including adding the deferred payments to your mortgage balance, modifying or extending your loan or setting up a repayment plan. We recommend that you work with your servicer to confirm the terms and details of the forbearance and the repayment program.

  • More flexible mortgage payment deferral program following the forbearance. This program currently applies to FHA, VA and USDA mortgages and loans owned by Fannie Mae and Freddie Mac. Mortgages that do not fall into these categories may be eligible for similar programs. We recommend that you contact your lender to learn more about available assistance options.

If your mortgage was in forbearance due to COVID-19 financial challenges, but you recover financially and are able to make your payments in the future, your missed principal and interest payments may be deferred and added to your loan amount if you are not able to bring your mortgage current.

This means you are not required to make a lump sum payment when you resume your mortgage payments. You are usually required to bring your mortgage current before your lender accepts your payments again, which may not be possible if you have limited funds due to a financial hardship.

The best way to demonstrate how this program works is with an example.  Let’s say your loan was in forbearance and you miss your mortgage payments for three months due to a layoff or job loss but then you return work.  You may be able to afford your monthly mortgage payment again but you may not be able to afford to bring your loan current by paying the three months worth of past due interest and principal.

In this case, the missed payments are deferred and added to your mortgage balance.  From a technical standpoint, the amount of the deferred payments become a subordinated loan — also known as a partial claim — that does not need to be repaid until you pay off your mortgage . You do not pay any interest on the payment deferral / subordinated loan and you should not be charged any late fees or penalties to participate in the program. 

To be eligible for this specific mortgage payment deferral program you must make your full monthly payment in the month you apply for the deferral.  Additionally, you must have been current or less than 31 days delinquent on your loan as of March 1, 2020. There are additional guidelines you must meet to qualify so it is important to review program terms with Fannie Mae or Freddie Mac and your mortgage servicer.

Please note that if your loan is owned or secured by Fannie Mae or Freddie Mac, your mortgage servicer may receive $500 and be reimbursed for certain transaction costs so they are incentivized to help you with the payment deferral.

  • At the end of the forbearance plan, you may also be eligible for a loan modification that adds the missed monthly payments to the end of your mortgage or reduces your ongoing monthly payment.

A loan modification is a permanent change in your mortgage terms designed to make your loan — plus your property tax, homeowners insurance and other housing-related expenses — more affordable.  Fannie Mae, Freddie Mac, the FHA, VA and USDA have guidelines in place to ensure that the modification is sustainable and reflects your financial situation at that time.

If the payments you missed due to forbearance are added to the end of your loan, this modification effectively extends the length of your mortgage. So if you have a 30 year loan and your mortgage was in forbearance for a year, the twelve missed monthly payments are added to the end of your loan and you now have a 31 year mortgage.

If you cannot afford your payment after the forbearance period, you may also be able to modify your loan to reduce your monthly payment. Please note that to be eligible for most COVID-19 related loan modifications, you must have been current or less than 31 days delinquent on your mortgage as of March 1, 2020.

In July 2021, the FHA announced a new loan modification program for borrowers who cannot afford their monthly mortgage payment when their forbearance plan ends. This program enables eligible borrowers to extend their current mortgage to a maximum of 360 months (30 years) with a fixed interest rate.

For example, if you are ten years into your current 30 year mortgage — which means you have 20 years remaining — you can modify your FHA loan so you have 30 years to pay it off. Extending the length of your loan reduces your monthly payment, making your mortgage more affordable. If you have an FHA mortgage we recommend that you contact your lender to learn more about the loan modification program.

  • For borrowers whose mortgage is owned by Fannie Mae, access to its Disaster Response Network.

You can use this Fannie Mae service to understand your mortgage assistance options and to work with a HUD-approved counselor to develop a plan tailored to your individual needs.  The Disaster Response Network can also help you communicate with your mortgage servicer — the company you make your mortgage payments to — and other third parties including homeowners insurance companies.  You can contact the Fannie Mae Disaster response network by calling 1-877-542-9723.

We also want to highlight that in many cases you are not required to document the COVID-19 financial hardship that you are experiencing.  This removes a potential obstacle and makes it easier to qualify for these programs.

Additionally, these mortgage assistance options are applicable to primary and second homes as well as one-to-four unit investment properties.

How do I determine if I am eligible for the mortgage assistance outlined above?

To be eligible for these specific assistance measures, you need to have an FHA, VA or USDA loan or your mortgage needs to be owned or secured by Fannie Mae or Freddie Mac, as specified above.  Keep in mind that even if Fannie Mae or Freddie Mac own or secure your loan, you usually make your monthly payment to a different company, called a mortgage servicer.  You can use the resources below to determine if Fannie Mae or Freddie Mac own your mortgage.

Although you usually need to work directly with your servicer to implement changes to your mortgage — which means it is usually a good idea to call them first — you can also contact Fannie Mae or Freddie Mac to learn more about programs that may be applicable to you.  They can help you understand the resources available to you, navigate mortgage assistance options and explain how to work with your servicer. We have provided contact information for these organizations below.

Fannie Mae

1-800-232-6643

Fannie Mae COVID-19 Response Website

Freddie Mac

1-800-373-3343

Freddie Mac COVID-19 Response Website

If you have an FHA, VA or USDA loan, your first step is also to contact your lender or mortgage servicer.  You can also contact the FHA or USDA with any questions or if your lender is not aware of the assistance programs that are available.

FHA

877-234-2717

FHA Website

VA

800-827-1000

VA Housing Assistance Website

USDA

800-414-1226

USDA Rural Development Website

What should I do if I am impacted by COVID-19 and my mortgage is not owned by Fannie Mae or Freddie Mac or I do not have an FHA, VA or USDA loan?

In this case, your first step should be to call your mortgage servicer — the company you make your payment to.  Even if your loan is not covered by the guidelines outlined above, your lender should be willing to work with you to develop a solution that keeps you in your home.

During this unprecedented time of uncertainty we are seeing many companies do the right thing even if they are not legally obligated to do so. For example, Bank of America, Chase, Citibank, U.S. Bank, Wells Fargo and approximately 200 other banks and credit unions announced penalty-free payment deferral programs for up to 90 days for borrowers negatively affected by COVID-19.

It is important to carefully understand the terms of any mortgage assistance program before you enter into it. Some programs are non-interest bearing but you should confirm the terms with your servicer.

Additionally, with some payment deferral programs offered by private lenders you are required to bring your mortgage current by paying any past-due principal, interest and fees before you can resume your payments. This may be challenging if you miss three months of payments and you are struggling to catch up financially.

Servicers are overwhelmed with calls from distressed borrowers and it may take some time to actually speak with someone so you may need to be extra persistent. Also, not all servicers are aware of the programs they should be offering homeowners so it is important to be informed and know your options. If you believe you are eligible for mortgage relief do not take no for an answer.

What if my mortgage lender or servicer is not helpful?

If your lender is not cooperative and you are falling behind on your mortgage, we recommend that you review the resources available through HUD’s Making Home Affordable Program. HUD offers counseling and foreclosure prevention services to help borrowers who are struggling to pay their mortgage.

If you believe your lender is acting in bad faith or denying you assistance you are entitled to, we encourage you to contact the Consumer Financial Protection Bureau (CFPB).  In some cases, filing a complaint can motive a lender to do the right thing.  The CFPB may also be able to provide more information about your rights as a borrower and homeowner.

We also provide a link below to multiple refinance assistance programs that may be helpful to you.  This list includes several conventional and government-backed refinance programs so you can review a wide range of financing options.

Don’t get taken advantage of

The final point we want to reiterate is that all of the programs listed above are available to borrowers at no cost. If someone attempts to charge you to provide access to these programs or to defer or modify your loan, this is a scam. Some people try to exploit vulnerable borrowers during trying times but you can avoid this outcome if you are informed and know your options.

In closing, we recognize that these are challenging times, especially if you are experiencing financial adversity and cannot pay your mortgage.  It is important to know that if you are struggling financially due to COVID-19, there are multiple assistance options to help you stay in your home.

We will continue to update this post as more information becomes available. We hope this article is a helpful resource but please do not hesitate to contact FREEandCLEAR with any mortgage-related questions during this time. 

1-800-822-0138

Contact FREEandCLEAR

Thank you,

The FREEandCLEAR Team

About FREEandCLEAR

FREEandCLEAR is a leading mortgage website that empowers people to find the mortgage that is right for them.  Developed by a father and son team, FREEandCLEAR offers free tools and resources that enable borrowers to make more informed decisions and save money when they get a mortgage.

Sources

“Fannie Mae Assistance Options for Homeowners Impacted by COVID-19.”  Know Your Options.  Fannie Mae, March 18 2020.  Web.

“Our COVID–19 Response.”  My Home by Freddie Mac.  Freddie Mac, March 18 2020.  Web.

“Payment Deferral.”  Lender Letter (LL-2020-05).  Fannie Mae, March 25 2020.  Web.

“HUD Provides Immediate Relief For Homeowners Amid Nationwide Coronavirus Response.”  HUD No. 20-042.  U.S. Department of Housing and Urban Development, March 18 2020.  Web.

“USDA Implements Immediate Measures to Help Rural Residents, Businesses and Communities Affected by COVID-19.” USDA Rural Development. U.S. Department of Agriculture, March 25 2020. Web.

“Lump Sum Repayment is Not Required in Forbearance.”  My Home by Freddie Mac.  Freddie Mac, April 27 2020.  Web.

“Federal Housing Administration Announces Additional Covid-19 Recovery Options For Homeowners.” HUD No. 21-115. U.S. Department of Housing and Urban Development, July 23 2020. Web.
Is the Housing Affordability Crisis a Myth?

Study Highlights

  • Against a backdrop of an ostensible housing crisis, FREEandCLEAR measured housing affordability for all 3,142 counties in the U.S.
  • According to our analysis, only 138, or 4.4%, of U.S. counties are unaffordable housing markets
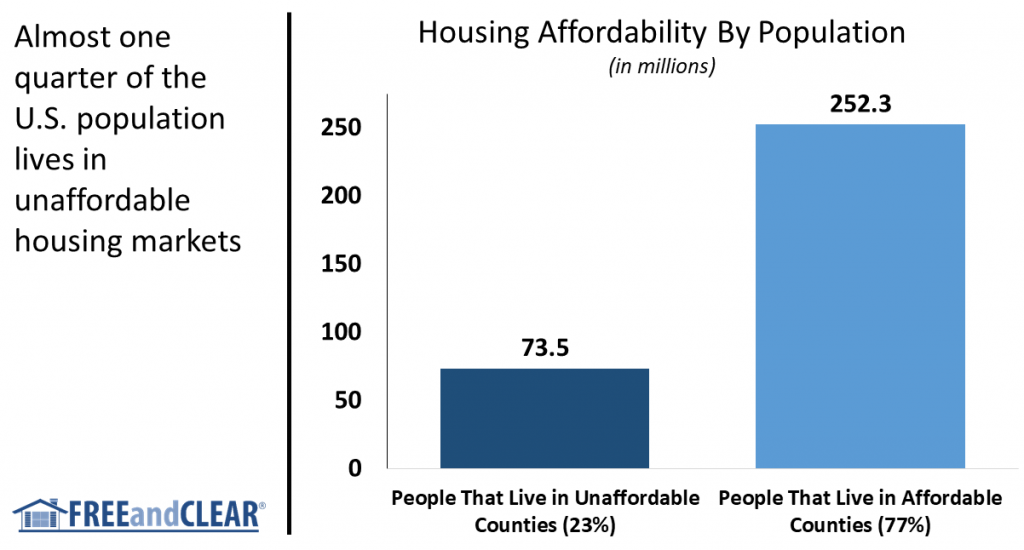
  • Unaffordable counties comprise a combined population of 73.5 million people, or approximately 25% of the U.S. population
  • The U.S. housing market is overwhelmingly affordable on a geographic basis although pockets of significant unaffordability exist that impact a meaningful portion of the population

Study Goals

We are often bombarded with headlines that highlight the lack of affordable housing in the United States.  A limited supply of reasonably priced housing inventory is cited as the primary reason why more people are not buying homes in certain markets and is one of the main factors that contributed to the slowdown in the housing market over the past year.  The theory goes that as home prices continue to rise, owning a home becomes out of reach for more people.


FREEandCLEAR decided to dig beneath the headlines to explore the question of how unaffordable the housing market truly is.  Because like politics, all real estate is local, we analyzed the housing affordability for all 3,142 counties in the United States.  Our findings suggest that housing affordability in the vast majority of U.S. markets is far better than the headlines suggest. But like with most housing-related issues, the answer is complicated and depends on where you live.


How We Define Housing Affordability

Housing affordability is determined by two primary factors: home prices and income.  Homes may be expensive in a given market but if the people in that area earn a lot of money then the housing is affordable on a relative basis.


To measure housing affordability we compared the home value for each county to what price home you can buy based on the median household income for that county.  If people who earn the median household income in an area can afford to buy a home that is greater than the median home value for that area, then that housing market is affordable.  If the median household income does not enable you to buy a home at the median value, the housing market is unaffordable.


For example, if the median home value for a county is $100,000 and a family that earns the median household income can afford to buy a home priced at $125,000, then the majority of households in that county should be able to afford to buy a home (assuming there is available inventory) and the housing market is relatively affordable.


Alternatively, if the median home value for a county is $100,000 but a family with the median household income can only afford to buy an $80,000 home, then most families cannot afford to buy homes and the housing market is relatively unaffordable.


The higher the home price you can afford based on household income relative to the home values for a county, the more affordable the county is.  The lower the home price you can afford relative to the median home value for a county, the more unaffordable the county is.


The Data We Used

The U.S. Census Bureau’s American Community Survey (ACS) offers a treasure trove of information including population, median household income and median home value by county.  The most recent ACS data are for 2017 so we applied 2018 wage growth according to the Bureau of Labor Statistics (BLS) to update median household income. To update media home values, we used the Federal Housing Finance Agency’s (FHFA) house price index data on both a metropolitan statistical area and state level.   


To determine what price home you can afford based on median household income we used the current mortgage rate, assumed a 10% down payment and assumed that home buyers spend approximately 15% of their gross income on non-housing related debt expenses such as credit cards and car, student and personal loans.


We provide our analysis on an example county below:


County: San Francisco

Population: 884,363

2018 Median Home Value: $1.26 million

2018 Median Household Income: $99,200

Home You Can Afford Based on Median Household Income: $535,000

Home You Can Afford Based on Median Household Income / Median Home Value: 43%

Is County Housing Market Affordable? No

  • Please feel free to contact us with any questions regarding our data sources or methodology


Our Findings on Housing Affordability By County

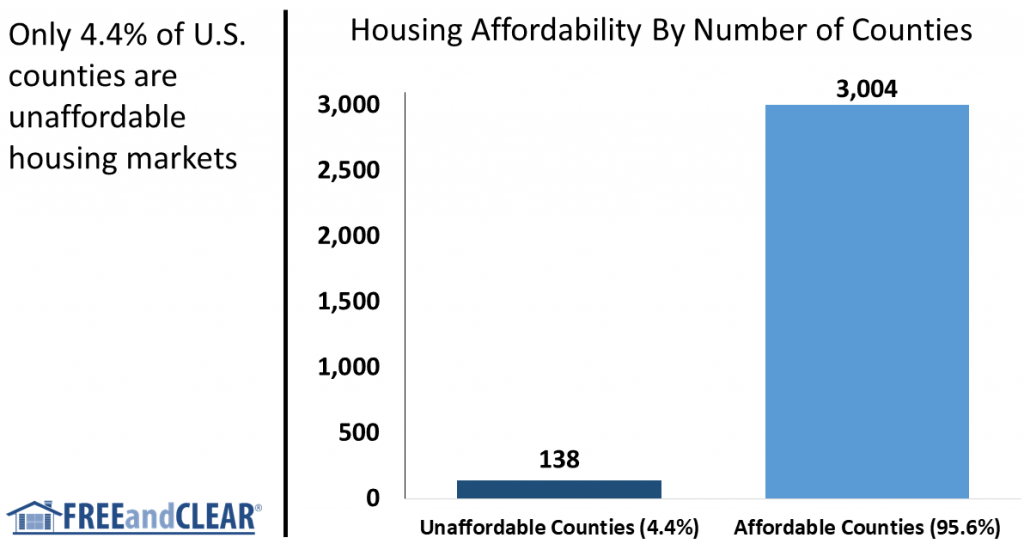
We crunched the numbers for every county in the U.S. and found that 3,004 out of 3,142 counties, or 95.6% of counties, are affordable housing markets.


For example, in Dallas, Texas, based on median household income you can afford to buy a $297,900 home, which is 155% of the median home value of $192,000, demonstrating that this market is relatively affordable.


According to our analysis, only 138 out of 3,142 of U.S. counties, or 4.4%, are unaffordable housing markets.  In these counties, the home you can afford to buy based on median household income is less than the median home value for the county.


For example, in San Francisco, California, the price of the home you can afford to buy based on median household income, $535,000, is 43% of the median home value of $1.26 million, which highlights how challenging it is to buy a home in this market.


The chart below compares the number of counties with affordable housing to the number of counties with unaffordable housing and illustrates the overall affordability of the U.S. housing market.

housing affordability by county

Source: FREEandCLEAR

Our Findings on Housing Affordability By Population

Given the sluggish state of the housing market and the public perception that we are in the middle of a housing crisis it may be surprising and even a little shocking that such a small number of housing markets are unaffordable.  The data on the number of counties, however, paint an incomplete picture. As our study reveals, the number of counties may be less important than the number of people who live in those counties and where they are located.


While only 138 counties measured as unaffordable, these counties comprise a combined population of 73.5 million people, or almost 25% of the U.S.population.  In short, approximately a quarter of the population lives in unaffordable housing markets, underscoring the challenge facing prospective home buyers in many of the nation’s largest metropolitan areas.


The chart below compares the number of people who live in counties with affordable housing markets to the number of people who live in unaffordable counties. As the chart illustrates, a significant portion of the U.S. population may not be able to afford to buy a home where they live.

housing affordability by population

Source: FREEandCLEAR

The Least Affordable Housing Markets — Location Matters

It is also important to highlight that the counties with the least affordable housing markets are concentrated on the coasts and in major media markets.  This geographic concentration creates potential location bias that can influence how housing affordability issues are covered by the media and generally perceived. The headlines may reflect limited housing affordability for major markets while the dynamic for any individual county may be significantly different.   


The table below shows the fifty least affordable housing markets in the United States.  As you can see, a significant number of these markets are located in California and New York.

the least affordable housing markets in the U.S.

Source: FREEandCLEAR

  • Please contact us to learn the national and state housing affordability ranking for any county in the U.S.


The Most Affordable Housing Markets Offer Limited Housing Stock

While the least affordable housing markets tend to be located in major metropolitan areas, the most affordable markets are concentrated in rural areas with limited housing supply.  So even if a housing market is affordable, there may not be much housing inventory to choose from. Housing affordability is only meaningful if people have the opportunity to buy homes in those markets.


The table below shows the fifty most affordable housing markets in the U.S.  A significant number of these markets are Midwest counties with relatively small populations and housing markets.

the 50 most affordable housing market in the U.S. by county

Source: FREEandCLEAR

Conclusion

While we tend to focus on the top and bottom 50 housing markets it is important to keep in mind that there are 3,042 counties in between with varying degrees of housing affordability and inventory.  Additionally, although our study analyzed housing affordability for 3,142 counties, some counties are comprised of tens or even hundreds of local cities and neighborhoods with their own unique housing dynamics.


Potential home buyers and sellers are well-served to research their local markets to understand the housing supply-demand dynamic as well as what price home they can afford based on their individual personal and financial circumstances.  Based upon the results of our study, buying a home may be more affordable than you think but it all depends on where you live.


About FREEandCLEAR

FREEandCLEAR is a leading mortgage website that offers free tools and resources that empower people to find the mortgage that is right for them.  FREEandCLEAR was developed by a father and son team who are on a mission to help people make better decisions and save money when they get a mortgage.  Our valuable resources and rate tables put borrowers in control of the mortgage process and enable them to easily shop for a mortgage.

Significant Gender and Racial Housing Gaps Persist

Gender and racial inequality has emerged as one of the most important issues of our time.  Disparities between women and men as well as between different racial groups exist within multiple areas of society including pay, employment opportunities and housing.  While significant attention has been paid to income gaps, it is also vital to examine the impact of gender and race in the housing market.


The recent release of the Census Bureau household income report for 2017 provides a new framework for examining these crucial social subjects.  The report contains a tremendous amount of interesting information on incomes including breakdowns by gender, race, geography and other factors.  The report was generally viewed positively as median household income increased 1.8% and hit an all time high of $61,372.


While the headline income figures are relatively positive, a deeper dive into the data reveals a more complicated story.  When viewed on a more granular level and applied to housing, the household income report reflects a housing market that is fractured along gender and racial lines and becoming less affordable.


The Relationship Between Household Income and Housing

Income and the housing market are inextricably linked.  Simply put, how much money you make is the most important factor in determining what size mortgage you qualify for which ultimately determines how much home you can afford.  Other inputs such as your down payment, monthly debt expenses, credit score and mortgage rate also play a significant role but housing affordability starts with your income. The more money you earn, the higher price home you can afford.  The less you make, the less home you can afford. So while the Census Bureau report addresses household income, we can use the data to learn a lot about the housing market.


The Housing Gender Gap Widens

While housing affordability affects everyone, its impact is magnified when the issue is analyzed by gender.  Specifically, the housing gender gap widened based on the latest census bureau data. Reported median male household income of $60,843 was approximately 46% higher than median female household income of $41,703.  The report analyzes different types of households and these figures are for family households with only one spouse present, such as a household with a single mom or dad whose children live with them. No matter what definition you use, the gender household income gap is striking and the implications for housing affordability are equally significant.  


The chart below shows how much house you can afford based on median female household income, median male household income and the median income for all households.  For the purpose of this example we used our mortgage qualification calculator to determine what size loan a household could afford and assumed people spend on average 6% of their gross income on non-housing debt expenses such as credit cards, auto and student loans.  We also assumed the average home buyer makes a down payment of 10%.


Based on our analysis, the median female household can afford to buy a $282,356 home as compared to a $412,127 home for the median male household and a $415,673 home for all households. Put differently, based on median income, a female household can afford almost a third less home than a male household.


Gender housing gap

Source: FREEandCLEAR, based on 2017 median household income for female and male family households


The graph illustrates how the gender pay gap manifests itself in the housing market.  Female households, a significant portion of which are also single mother households, can afford significantly less home than male households.  This dynamic takes on even more significance when you consider that there are approximately 15.4 million female family households as compared to only 6.4 million male family households, according to Census Bureau data.


The trend is even more acute because the Census Bureau data suggest that the housing gender gap is expanding.  While median male household income grew 2.6% in 2017, median female household income declined 0.5%, for a net difference of 3.1%.  So not only do male households make more money but their earnings are growing faster.  Both the difference and dip in earnings, when combined with increased home prices, reinforce that housing became significantly less affordable for female households.


Race and Housing Affordability

The report also enables us to better understand the relationship between race and housing.  A wide disparity in household income exists among the four racial groups used by the Census Bureau — Asian, Black, Hispanic and White — and these differences certainly influence housing affordability.


Reported Asian median household income of $81,331 compares to $68,145 for White households, $50,486 for Hispanic households and $40,258 for Black households. This is a significant range with the highest earning racial group making more than twice the household income of the lowest earning group.


The graph below shows how housing affordability breaks down by race.  Using the same methodology that we applied above, the median Asian household can afford to buy a $550,858 home, the median White household can afford a $461,541 home, the median Hispanic household can afford a $342,023 home and the median Black household can afford a $272,750 home.  We also compare these figures to the home price based on the median income for all households.


racial housing gap

Source: FREEandCLEAR, based on median household income by racial group


While issues of race and housing are complex, there should be no debate that the income differential has a profound impact on how much home people can afford.  Income disparities also affect neighborhood access and housing mobility for lower-earning racial groups.


It is also important to highlight that while Hispanic and White median household income grew 3.7% and 2.6%, respectively, Asian and Black household income decreased 2.2% and 0.2%, respectively. As incomes shift along racial lines, so does housing affordability.


Housing is Becoming Less Affordable

While it is good news that people are making more money, the growth in household income is decelerating.  Median household income grew 1.8% in 2017 as compared to growth rates of 3.1% and 5.1% in the two prior years.


Slowing income growth is not necessarily a bad trend as long as the items you want to buy, such as housing, grow at a similar rate. If prices for the goods you want to buy increase at a faster pace, your dollars do not go as far and the item effectively becomes more expensive.  Unfortunately, housing prices increased at a much higher rate than median household income in 2017, which means that people could afford less home for their money, despite earning a higher income.


As illustrated in the graph below, the median existing home sales price increased 6.0%, or more than triple the growth rate for household income, and the median new home sales price increased 4.9%, or more than two and a half times income growth.


Growth rates for household income, median new home sales price and median existing home sales price

Source: US Census Bureau, National Association of Realtors, 2017 growth rates


The chart confirms what most people who shopped for a home over the past several years already knew on a more personal level — buying a home is becoming more expensive and your housing dollars do not buy as much home as they used to.


This dynamic manifests itself in the housing market in several ways. First, people may not be able to afford the house they want to buy.  They may settle for a two bedroom home instead of the three bedroom home that is more suitable for their family. Other people may be priced out of certain neighborhoods.  In short, as homes become more expensive, your housing options become more limited, especially if you find it challenging to qualify for the mortgage you need to buy the home you want.


But Housing is Still Affordable (At Least on a National Level)

Although the household income data reveal significant gender and racial housing affordability gaps and that buying a home is becoming more expensive, one positive take away from the report is that housing remains affordable, at least at the highest, most macro level.


One way to assess overall housing affordability on a national level is to compare how much home you can buy based on the median household income to home sales prices.  If you can afford to buy the median priced home with median household income, then housing is relatively affordable. If you cannot afford to buy the median priced home with median household income, this reveals an imbalance in the market and home prices are likely not sustainable.


The graph below compares what price home you can buy based on median household income to the median existing home sales price and median new home sales price.  We apply the same assumptions as above — 10% down payment and 6% of gross income spent on monthly debt — to determine what price home a household can afford.


As the chart shows, even with these relatively conservative assumptions, the $415,637 home price you can afford based on median household income is greater than both the median existing and new home sales prices.


Source: FREEandCLEAR, US Census Bureau, National Association of Realtors

Source: FREEandCLEAR, US Census Bureau, National Association of Realtors


It is important to emphasize that the above analysis is based on national data and that incomes and housing prices vary greatly by city and neighborhood.  While housing may be affordable on a national basis, your area may have a very different dynamic. Plus we have already shown how gender and race factor into housing affordability.


Closing Thoughts

Although the link between income and housing affordability is clear, there are several caveats regarding the Census Bureau data.  Although the report was released recently, the median household income data are for 2017. So while this is the most updated information available, it is somewhat dated.  Despite this, housing prices have continued to rise over the course of this year, albeit at a slower pace, while home sales have moderated, suggesting that the crux of the analysis remains applicable.


Additionally, while the primary purpose of the Census Bureau report is to examine trends in household income, it can be used to explore and analyze other important socioeconomic topics.  In this case, we used the report and its valuable data to better understand the complex relationship between income, housing affordability, gender and race. We shine a light on these important issues with goal of creating a more fair, affordable and accessible housing market.


About FREEandCLEAR

FREEandCLEAR is a leading mortgage website that offers free tools and resources that empower people to find the mortgage that is right for them.  FREEandCLEAR was developed by a father and son team who are on a mission to help people make better decisions and save money when they get a mortgage.  Our valuable resources and mortgage rate tables put borrowers in control of the mortgage process and enable them to easily shop for a mortgage.

FREEandCLEAR Launches Groundbreaking Mortgage Lender Directory

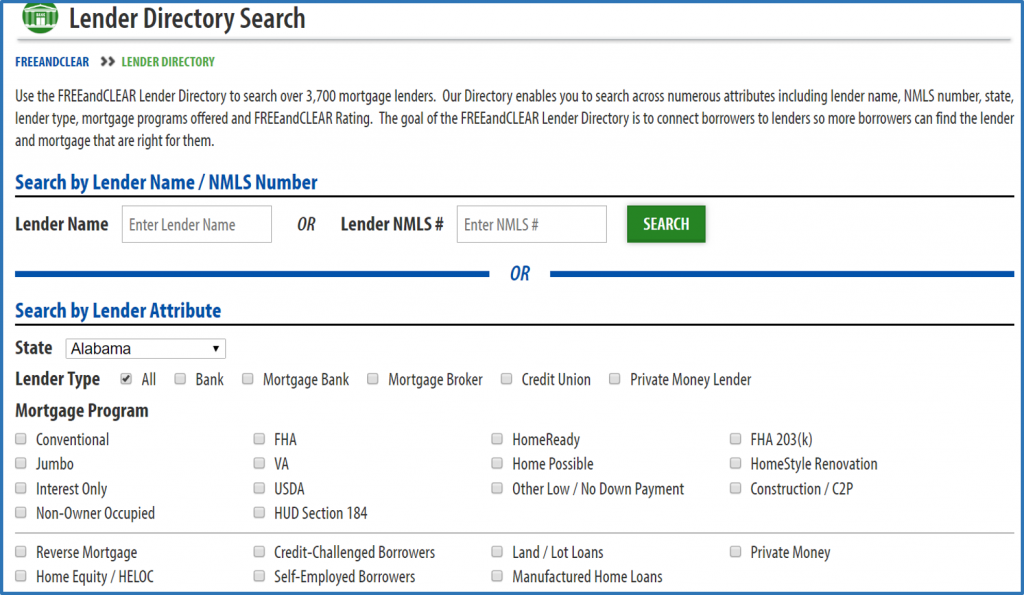
FREEandCLEAR launched its groundbreaking Mortgage Lender Directory which transforms the way people search for a mortgage.  Believed to be the largest of its kind, the directory features over 3,700 lenders, over 100,000 unique data points and offers a level of functionality unparalleled in the mortgage industry.  


The directory was developed in response to consistent feedback from borrowers who find it challenging to find lenders that offer specific mortgage programs, especially first-time home buyers who are looking for low down payment programs.  In short, the FREEandCLEAR Lender Directory fundamentally changes the way people find mortgages and empowers more people to buy homes.


FREEandCLEAR Lender Directory

The FREEandCLEAR Lender Directory changes the way you search for a mortgage


Key features of the FREEandCLEAR Lender Directory include:

  • Search by 25 loan programs including FHA, VA, USDA, HomeReady, Home Possible as well as programs for credit-challenged and self-employed borrowers
  • Search by lender type including banks, mortgage banks, mortgage brokers, credit unions and private money lenders
  • Search by FREEandCLEAR rating including Certified Low Rate Lender, Mortgage Program Leader and Technology All Star
  • Submit and review lenders reviews based on multiple criteria

FREEandCLEAR developed the directory to further its mission of connecting borrowers and lenders and to increase transparency, accountability and actionability in the mortgage industry.  The FREEandCLEAR Lender Directory also compares mortgage rates, loan programs and user experience and awards badges to the top-ranked lenders in each category.


Aggregating such a tremendous amount of data and making it easily searchable helps borrowers find the lenders and mortgage programs that best meet their needs.  The directory is free to use and for lenders to join which makes it highly accessible to both borrowers and lenders.


FREEandCLEAR Mortgage Lender Directory

The FREEandCLEAR Lender Directory offers valuable information for borrowers


The FREEandCLEAR Lender Directory takes on even greater importance at a time when transparency in the mortgage industry is declining.  The directory provides a voice for borrowers as well as feedback for lenders who can use this information to improve their businesses. Ultimately increased accountability benefits both borrowers and lenders.


We would love for you to use the directory and pass along your feedback.  With your help we can improve the mortgage experience for both borrowers and lenders.

Study Shows Getting Mortgage Quotes Saves You Money

At FREEandCLEAR we are strong advocates for shopping multiple lenders to find the lowest mortgage rate and best loan terms.  Lowering your interest rate by just a small amount can save you hundreds or even thousands of dollars over the life of your mortgage and now there is a new study that proves it.  


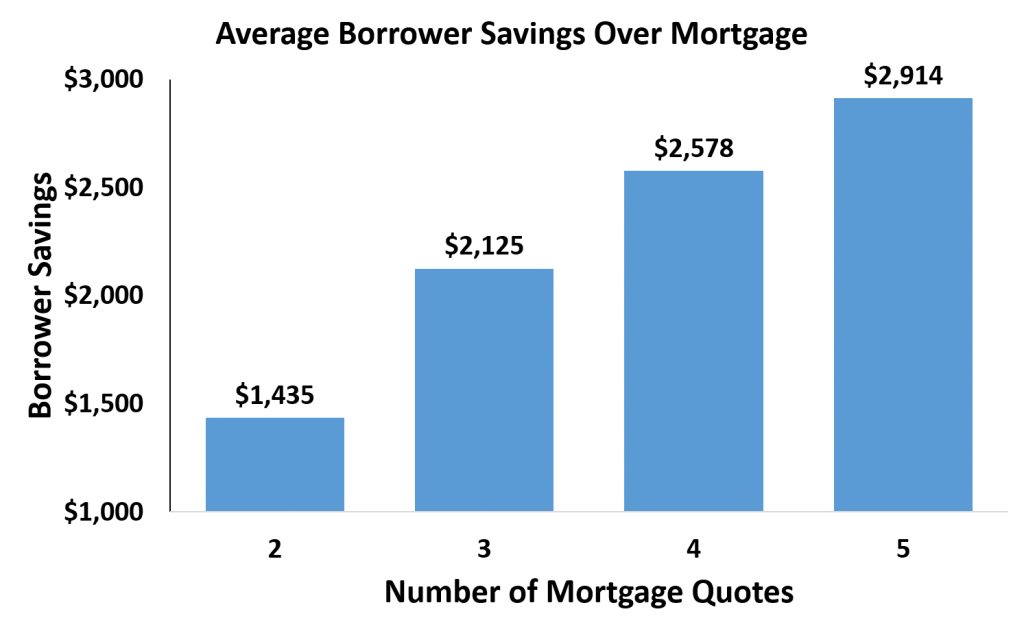
According to a report by mortgage industry leader Freddie Mac, borrowers can save an average of $1,435 by comparing two mortgage quotes and almost $3,000 by comparing five mortgage quotes.  Freddie Mac is not a lender but rather buys loans from lenders and helps shape mortgage policy. It is an important and impartial player in the mortgage industry which makes the report all the more meaningful. The findings of the study reinforce that just like any other product, shopping for a mortgage and comparing several lenders saves you money.


The chart below shows the average borrower savings depending on the number of mortgage quotes you compare.  The more quotes you compare, the more money you save on your mortgage.


comparing mortgage quotes saves borrowers money

Average borrower savings based on number of mortgage quotes reviewed (Source: Freddie Mac)


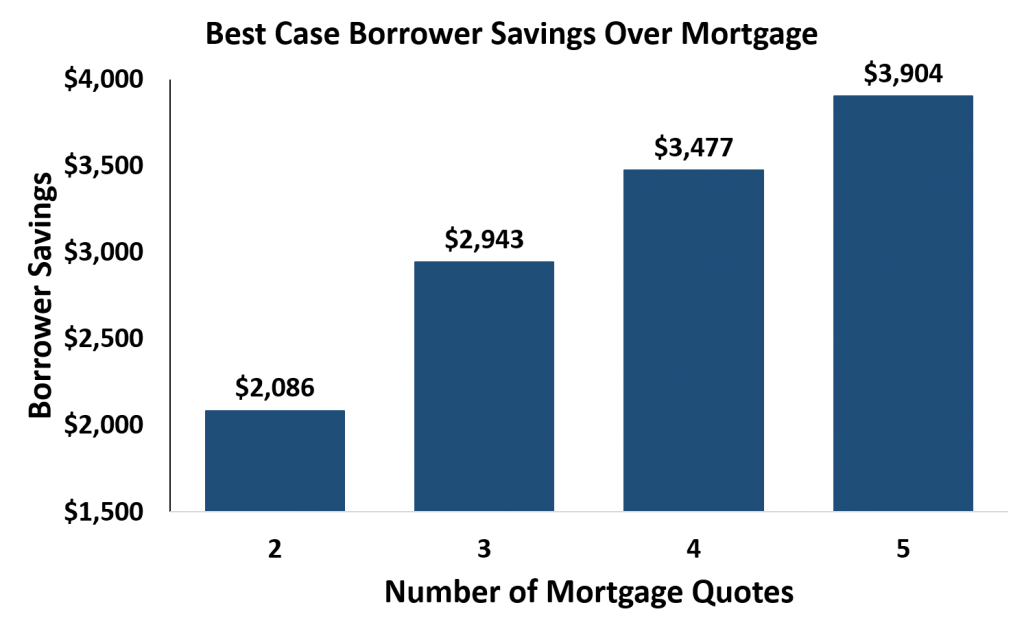
It is important to highlight that the above analysis is based on a $250,000 loan amount.  The larger the mortgage, the more money you save and vice versa. Another point to emphasize is that the chart above shows the average borrower savings and your actual savings may be much higher.  The chart below reflects more of a best case scenario when you compare mortgage quotes — basically how much money borrowers would save if they compared lenders offering the lowest mortgage rates among the thousands of lender options.


best case mortgage savings based on number of mortgage quotes compared

Best case scenario borrower savings based on number of mortgage quotes (90th percentile; source: Freddie Mac)


As the above chart demonstrates, borrowers that shop lenders that offer lower mortgage rates save even more money over the life of their loan.  In this best case, borrowers that compare two lenders save $2,086 while borrowers that get five mortgage quotes save a whopping $3,904. Again, this analysis is for a $250,000 mortgage and you save more with a higher loan amount.  The study is valuable because it quantifies how much money borrowers save when they shop for a mortgage as well as how much money they leave on the table by not shopping.


In light of how much money is at stake you would think that everyone shops for a mortgage but unfortunately that is not the case.  According to a recent survey by FREEandCLEAR, 36% of mortgage borrowers said they only received one mortgage quote when they got a mortgage.  That means over a third of borrowers failed to shop multiple lenders which could end up costing them thousands of dollars over the course of their mortgage.


The question becomes why don’t people shop for a mortgage?  After all, people shop multiple stores to find the best deal on a television and multiple dealerships to find the lowest price on a car.  How come this approach does not apply to mortgages as well?


There are several factors including the complexity of the mortgage process and the tight time frame many borrowers are under when they buy a home or refinance.  Additionally, most people only get a mortgage a handful of times during their lifetime so they may not be accustomed to comparing mortgage quotes like they would compare airline ticket prices.      


These days, however, it is easier and faster than ever to shop for a mortgage so there are no excuses for borrowers.  Our Personalized Mortgage Quote form enables you to receive free quotes from multiple lenders based on your specific situation.


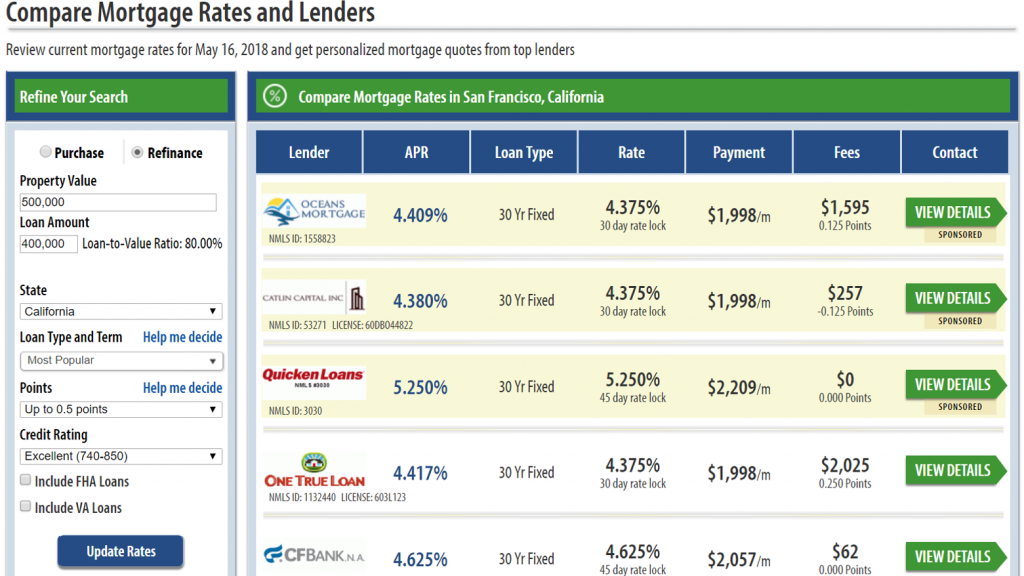
You can also compare mortgage rates and fees for lenders without providing any personal information by using our lender tables.  Our lender tables feature updated rates for multiple lenders and enable you to customize your mortgage shopping based on loan amount, loan-to-value (LTV) ratio, term, program and other factors.


mortgage lender table

Lender table on FREEandCLEAR


Whether you use the resources available on FREEandCLEAR or another service, we highly recommend that you compare multiple quotes before selecting a lender.  As the Freddie Mac study underscores, a little shopping goes a very long way when you get a mortgage.

New Regulations Allow Lenders to Offer Closing Cost Assistance

Fannie Mae, the organization that is responsible for helping to shape mortgage program guidelines, recently announced a new policy that enables lenders to offer closing cost assistance directly to borrowers.  Fannie Mae is not a lender but its policies and regulations have a significant impact on lenders and the mortgage programs they offer directly to borrowers.


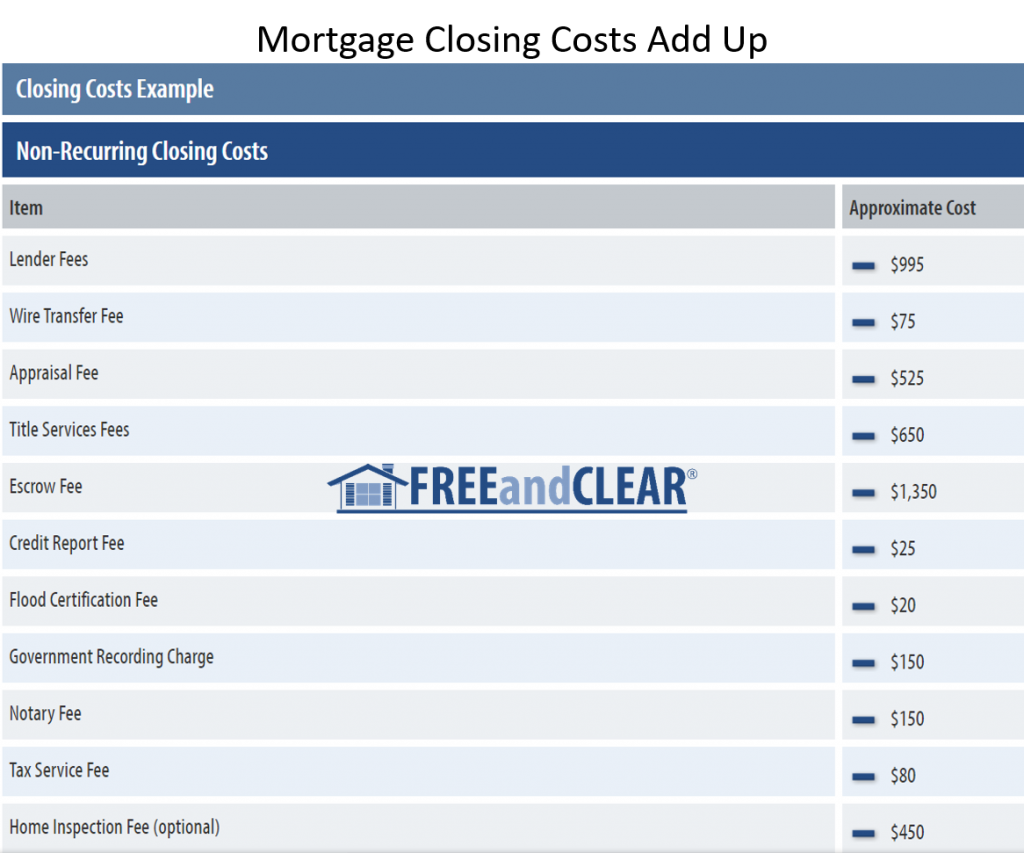
This announcement is significant because many borrowers struggle to save the funds to pay for closing costs, especially if they are focused on saving for their down payment.  Although closing costs vary depending on your lender, loan amount, mortgage program and property value, they are generally 1% to 2% of your loan amount which equates to thousands of dollars for borrowers.  In many cases borrowers are surprised at both the amount of closing costs as well as the items included. For example, in addition to paying numerous one-time, non-recurring costs such as lender, settlement agent, title insurance and appraisal report fees, borrowers are also required to pay a portion of ongoing, or recurring, closing costs such as partial interest expense, property tax and homeowners insurance.


Needless to say, these expenses can add up quickly and catch borrowers off guard.  The last thing a prospective homeowner wants to hear is that they need to come up with thousands of dollars to close their loan and complete their property purchase.  Fannie Mae’s new policy addresses this borrower challenge by enable lenders to provide closing cost assistance to borrowers.


mortgage closing costs

Mortgage closing costs can run thousands of dollars


There are several provisions to the new policy that are highly beneficial to borrowers.  First, the lender closing costs assistance must be offered as grant that is not subject to repayment, so it is basically a gift from the lender.  With some closing cost assistance programs, you may be required to repay part or all of the grant depending on how long you live in the property. With lender closing costs assistance, you are never required to repay the money.


It is also important to highlight that the assistance can only be used to pay closing costs and not your down payment or other transaction expenses.  Additionally, the amount of the assistance cannot exceed the amount of closing costs. Finally, lenders should not increase their mortgage rate to pay for the assistance they are providing you.  This is called premium pricing and borrowers should make sure that their mortgage rate remains the same whether or not they are receiving closing cost assistance.


Lender closing cost assistance provides another option for borrowers with limited financial resources.  Borrowers can also apply for closing cost assistance grants with their state or local housing agencies or departments but this can be time consuming and limited funds are available.  Some larger companies also offer homebuyer assistance programs to employees. Both of these programs, however, usually impose certain restrictions on participants, such as living in the home or working for the company for a certain amount of time.


Lender closing cost assistance programs are promising because they are more flexible for borrowers and easier to access because they are offered directly by the lender.  While it is too soon to tell how many lenders will implement these programs, this is a positive development for both lenders and borrowers. Assisting with closing costs is another tool lenders can use to help more people qualify for mortgages and buy homes.


FREEandCLEAR will keep you abreast as lenders launch closing cost assistance programs so be sure to check back for future updates on this important topic.

If the Fed Raised Interest Rates, Why Did Mortgage Rates Go Down?

Last week the Federal Reserve raised its benchmark Federal Funds rate 0.250% to 1.500% to 1.750%.  The Federal Funds rate is a key interest rate that impacts the cost of borrowing for many financial institutions including banks and mortgage lenders.  When the Fed increases interest rates, mortgage rates typically increase as well but that did not happen last week.  In fact mortgage rates were flat or even down for most lenders following the Fed’s announcement.  How could mortgage rates actually fall if the Fed raised interest rates and what does this mean for borrowers?


Historical mortgage rates

30 Year Fixed Rate Mortgages Rates (Source: FREEandCLEAR)


Last week’s events teach us several important points about mortgage rates.  First, one of the most important determinants of mortgage rate pricing is market expectations.  The Federal Reserve had forecast its interest rate hike for several months so lenders were not surprised by the news.  Most mortgage lenders had already factored in the Fed’s rate increase into their mortgage rate pricing before the Fed’s official announcement, which helps explain the response, or lack thereof, by mortgage rate.  It is safe to assume that mortgage rates would have reacted differently if the Fed had raised interest rates by more than a quarter point or if they significantly changed their forecast for future rate increases, because this outcome would have been much different than what the market expected.


It is also important to realize that Federal Reserve has more policy tools at its disposal than the Federal Funds rate.  For example, the Federal Reserve has the ability to purchase securities in the open market to help implement policy mandates. During the great recession, the Fed purchased billions of dollars of mortgage backed securities and other debt products to help support the mortgage market and keep rates low.  While the Fed has stated its intention to “unwind” its balance sheet and sell down its portfolio of mortgage backed securities, it may also buy mortgage backed debt from time to time to stabilize the market. In other words, the Fed may be operating behind the scenes to prevent a rapid rise in interest rates.


A final point to highlight is that while the Federal Reserve is a very important factor in determining mortgage rates, it is not the only factor.   Other inputs like bond pricing, treasury yields, the stock market and other economic indicators also significantly influence mortgage rates. For example, the day after the Federal Reserve’s announcement, the stock market plunged in response to concerns over a potential trade war with China.  Investors sold stocks and bought bonds and treasuries, which caused yields on those securities to go down. Bond and treasury yields are one of the key inputs to mortgage rate pricing so when yields decline, mortgage rates typically decline or remain steady at worst. So in essence, mortgage borrowers can thank trade tariffs for helping to keep mortgage rates low.


Last week’s events remind us that in the near term, mortgage rates are unpredictable.  The Fed raised rates, yet mortgage rates were flat-to-down. Market expectations, bond yields and a multitude of other factors can cause changes to mortgage rates on a daily or even sometimes an hourly basis.  On any given day, mortgage rates may or may not respond to the Federal Reserve’s actions.


Over the long term, however, mortgage rates tend to move in the same direction as the Fed.  So while we may have been surprised that mortgage rates dipped slightly last week, it was likely only a temporary reprieve.  With the Fed reiterating its forecast of at least two more rate hikes in 2018 and potentially four rates hikes in 2019 we should expect rates to continue to rise over the course of the next twenty months, even if they occasionally dip along the way like they did last week.


Although there are no guarantees with mortgage rates, the Federal Reserve usually wins in the long run.  The next time the Fed raises interest rates, we may not be able to count on a potential trade war to hold mortgage rates down.  Given this dynamic, prospective home buyers and borrowers looking to refinance may benefit by acting sooner rather than later.