Is the Housing Affordability Crisis a Myth?
Study Highlights
- Against a backdrop of an ostensible housing crisis, FREEandCLEAR measured housing affordability for all 3,142 counties in the U.S.
- According to our analysis, only 138, or 4.4%, of U.S. counties are unaffordable housing markets
- Unaffordable counties comprise a combined population of 73.5 million people, or approximately 25% of the U.S. population
- The U.S. housing market is overwhelmingly affordable on a geographic basis although pockets of significant unaffordability exist that impact a meaningful portion of the population
Study Goals
We are often bombarded with headlines that highlight the lack of affordable housing in the United States. A limited supply of reasonably priced housing inventory is cited as the primary reason why more people are not buying homes in certain markets and is one of the main factors that contributed to the slowdown in the housing market over the past year. The theory goes that as home prices continue to rise, owning a home becomes out of reach for more people.
FREEandCLEAR decided to dig beneath the headlines to explore the question of how unaffordable the housing market truly is. Because like politics, all real estate is local, we analyzed the housing affordability for all 3,142 counties in the United States. Our findings suggest that housing affordability in the vast majority of U.S. markets is far better than the headlines suggest. But like with most housing-related issues, the answer is complicated and depends on where you live.
How We Define Housing Affordability
Housing affordability is determined by two primary factors: home prices and income. Homes may be expensive in a given market but if the people in that area earn a lot of money then the housing is affordable on a relative basis.
To measure housing affordability we compared the home value for each county to what price home you can buy based on the median household income for that county. If people who earn the median household income in an area can afford to buy a home that is greater than the median home value for that area, then that housing market is affordable. If the median household income does not enable you to buy a home at the median value, the housing market is unaffordable.
For example, if the median home value for a county is $100,000 and a family that earns the median household income can afford to buy a home priced at $125,000, then the majority of households in that county should be able to afford to buy a home (assuming there is available inventory) and the housing market is relatively affordable.
Alternatively, if the median home value for a county is $100,000 but a family with the median household income can only afford to buy an $80,000 home, then most families cannot afford to buy homes and the housing market is relatively unaffordable.
The higher the home price you can afford based on household income relative to the home values for a county, the more affordable the county is. The lower the home price you can afford relative to the median home value for a county, the more unaffordable the county is.
The Data We Used
The U.S. Census Bureau’s American Community Survey (ACS) offers a treasure trove of information including population, median household income and median home value by county. The most recent ACS data are for 2017 so we applied 2018 wage growth according to the Bureau of Labor Statistics (BLS) to update median household income. To update media home values, we used the Federal Housing Finance Agency’s (FHFA) house price index data on both a metropolitan statistical area and state level.
To determine what price home you can afford based on median household income we used the current mortgage rate, assumed a 10% down payment and assumed that home buyers spend approximately 15% of their gross income on non-housing related debt expenses such as credit cards and car, student and personal loans.
We provide our analysis on an example county below:
County: San Francisco
Population: 884,363
2018 Median Home Value: $1.26 million
2018 Median Household Income: $99,200
Home You Can Afford Based on Median Household Income: $535,000
Home You Can Afford Based on Median Household Income / Median Home Value: 43%
Is County Housing Market Affordable? No
- Please feel free to contact us with any questions regarding our data sources or methodology
Our Findings on Housing Affordability By County
We crunched the numbers for every county in the U.S. and found that 3,004 out of 3,142 counties, or 95.6% of counties, are affordable housing markets.
For example, in Dallas, Texas, based on median household income you can afford to buy a $297,900 home, which is 155% of the median home value of $192,000, demonstrating that this market is relatively affordable.
According to our analysis, only 138 out of 3,142 of U.S. counties, or 4.4%, are unaffordable housing markets. In these counties, the home you can afford to buy based on median household income is less than the median home value for the county.
For example, in San Francisco, California, the price of the home you can afford to buy based on median household income, $535,000, is 43% of the median home value of $1.26 million, which highlights how challenging it is to buy a home in this market.
The chart below compares the number of counties with affordable housing to the number of counties with unaffordable housing and illustrates the overall affordability of the U.S. housing market.
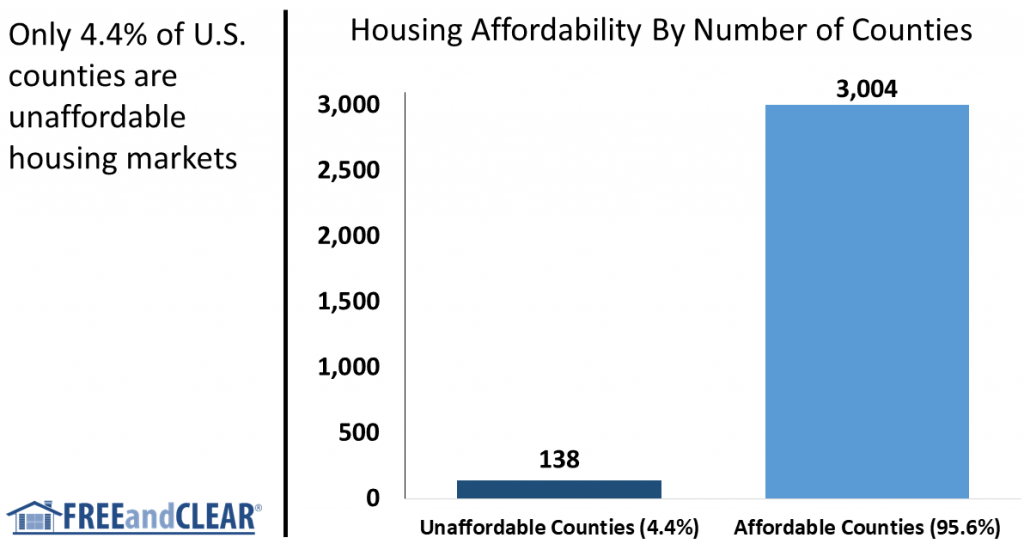
Source: FREEandCLEAR
Our Findings on Housing Affordability By Population
Given the sluggish state of the housing market and the public perception that we are in the middle of a housing crisis it may be surprising and even a little shocking that such a small number of housing markets are unaffordable. The data on the number of counties, however, paint an incomplete picture. As our study reveals, the number of counties may be less important than the number of people who live in those counties and where they are located.
While only 138 counties measured as unaffordable, these counties comprise a combined population of 73.5 million people, or almost 25% of the U.S.population. In short, approximately a quarter of the population lives in unaffordable housing markets, underscoring the challenge facing prospective home buyers in many of the nation’s largest metropolitan areas.
The chart below compares the number of people who live in counties with affordable housing markets to the number of people who live in unaffordable counties. As the chart illustrates, a significant portion of the U.S. population may not be able to afford to buy a home where they live.
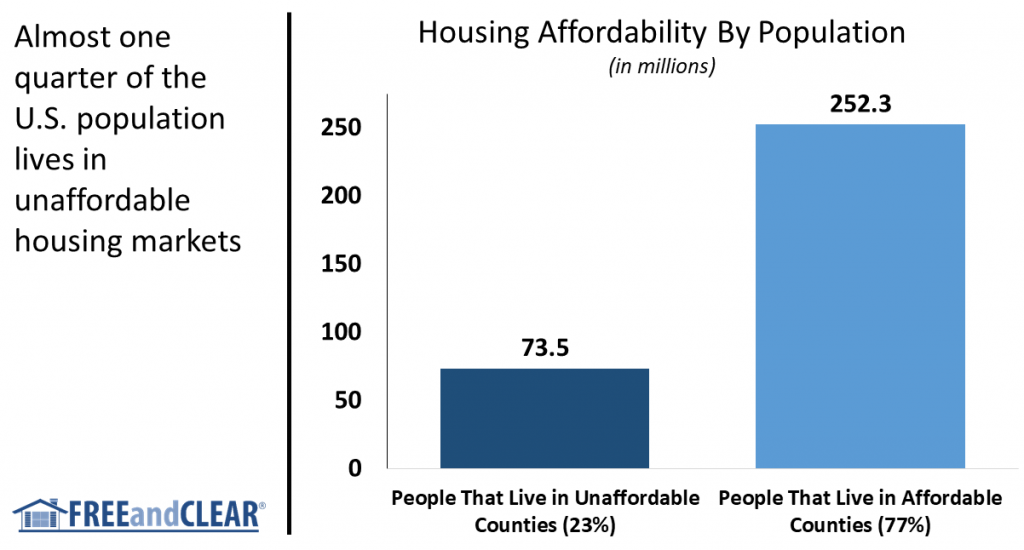
Source: FREEandCLEAR
The Least Affordable Housing Markets — Location Matters
It is also important to highlight that the counties with the least affordable housing markets are concentrated on the coasts and in major media markets. This geographic concentration creates potential location bias that can influence how housing affordability issues are covered by the media and generally perceived. The headlines may reflect limited housing affordability for major markets while the dynamic for any individual county may be significantly different.
The table below shows the fifty least affordable housing markets in the United States. As you can see, a significant number of these markets are located in California and New York.

Source: FREEandCLEAR
- Please contact us to learn the national and state housing affordability ranking for any county in the U.S.
The Most Affordable Housing Markets Offer Limited Housing Stock
While the least affordable housing markets tend to be located in major metropolitan areas, the most affordable markets are concentrated in rural areas with limited housing supply. So even if a housing market is affordable, there may not be much housing inventory to choose from. Housing affordability is only meaningful if people have the opportunity to buy homes in those markets.
The table below shows the fifty most affordable housing markets in the U.S. A significant number of these markets are Midwest counties with relatively small populations and housing markets.

Source: FREEandCLEAR
Conclusion
While we tend to focus on the top and bottom 50 housing markets it is important to keep in mind that there are 3,042 counties in between with varying degrees of housing affordability and inventory. Additionally, although our study analyzed housing affordability for 3,142 counties, some counties are comprised of tens or even hundreds of local cities and neighborhoods with their own unique housing dynamics.
Potential home buyers and sellers are well-served to research their local markets to understand the housing supply-demand dynamic as well as what price home they can afford based on their individual personal and financial circumstances. Based upon the results of our study, buying a home may be more affordable than you think but it all depends on where you live.
About FREEandCLEAR
FREEandCLEAR is a leading mortgage website that offers free tools and resources that empower people to find the mortgage that is right for them. FREEandCLEAR was developed by a father and son team who are on a mission to help people make better decisions and save money when they get a mortgage. Our valuable resources and rate tables put borrowers in control of the mortgage process and enable them to easily shop for a mortgage.
%