Monthly Archives: August 2017

How Do Borrowers Really Feel About Their Mortgage?

In the aftermath of the real estate crisis many borrowers expressed intense dissatisfaction toward their mortgage lenders.  Right or wrong, borrowers often accused lenders of putting them in bad mortgages that they did not really understand and could not really afford.  Although we do not have official statistics that measure borrower sentiment in 2008, it is safe to assume that hundreds of thousands of borrowers, if not more, claim they got a “raw deal” on their mortgages.


Fast forward almost ten years and how do current borrowers feel about their mortgages? According to the FREEandCLEAR Mortgage Survey, the vast majority of borrowers feel pretty good.  When asked “Do you feel like you got a good deal on your mortgage?” 90% of survey respondents selected yes as compared to only 10% who chose no.  In short, almost all borrowers feel like they got a good deal on their mortgage.


how do borrowers feel about their mortgage

90% of borrowers said they got a good deal on their mortgage


The results of this survey question certainly reflect well on mortgage lenders and show how much progress the lending industry has made over the past several years.  It is quite a remarkable turnaround given the state of the industry and borrower sentiment in the not so distant past.  So what is driving this newfound and very much welcome borrower positivity?


There are likely multiple factors that explain the FREEandCLEAR Mortgage Survey results.  First, whether they were coerced by regulators or on their own volition, lenders eliminated many of the exotic mortgage programs that contributed to much of the borrower dissatisfaction, frustration and anger.  Mortgages with negative amortization and pay-option ARMs have all but disappeared from the lending marketplace.  While it has definitely become more challenging to qualify for a mortgage, more borrowers are likely getting loans that they understand and can afford which leads to improved borrower sentiment toward lenders.


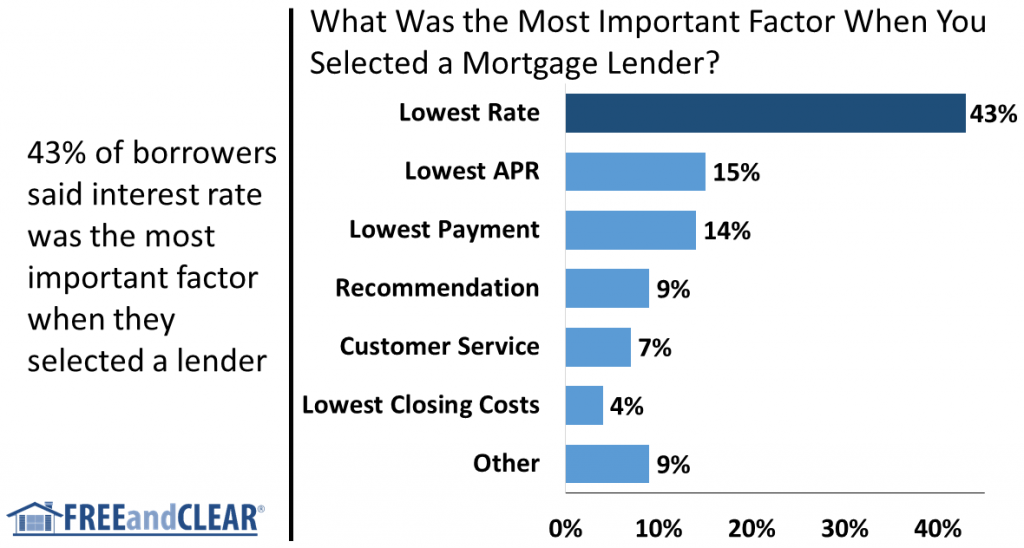
There are also macro factors that contribute to the positive vibes from borrowers.  The economy has stabilized, property values have improved and the mortgage default rate continues to hover near record lows.  More people staying in their homes certainly has a positive impact on how they feel about their mortgages.  Mortgage rates also remain near multi-decade lows which makes owning a home and paying the mortgage more affordable.  It is not a stretch to suggest that the lower your interest rate, the more likely you are to feel like you got a good deal on your mortgage and our survey results support this hypothesis.


While the FREEandCLEAR Mortgage Survey is overwhelmingly positive, it also shows that 10% of borrowers do not feel like they got a good deal on their mortgage.  While 100% customer satisfaction is impossible in any industry, the survey findings show that mortgage industry has room for improvement.  When you extrapolate the results across millions of borrowers it means that a lot of people do not feel positive about their mortgage.  The survey also makes us wonder how borrowers sentiment may shift if mortgage rates rise or if the real estate market falters.   For now, however, much-maligned lenders should be satisfied to know they are providing borrowers with a good deal on their mortgage.


We will continue to provide a detailed analysis of each survey question on our blog in the coming weeks and you can review the full results from the FREEandCLEAR Mortgage Survey to better understand how borrowers think about and experience the mortgage process.

What is the Most Important Factor When Borrowers Select a Mortgage?

There are many reasons to select a mortgage lender — an existing relationship, excellent custom service, positive recommendation — but one factor stands out to borrowers by an almost three-to-one margin according to the FREEandCLEAR Mortgage Survey.


When asked “What was the most important factor when you selected a mortgage lender?”, 43% of borrowers selected “lowest rate”, which topped the next highest response by almost 30%.  The results of the survey demonstrate that borrowers are keenly focused on finding the lender that offers the lowest interest rate when they shop for a mortgage.  While it is not surprising that borrowers focus on mortgage rate when selecting a lender, the margin by which “lowest rate” topped our survey does illuminate some interesting issues about the mortgage process.


most important factors when borrowers select a mortgage lender

Lowest rate is the most important factor when borrowers select a mortgage lender


It is telling that “APR” was the (distant) second-ranked selection, attracting only 15% of  borrower responses.  APR is similar to interest rate but also incorporates certain closing cost inputs.  Because it reflects both interest rate and closing costs, APR is intended to represent the “true cost” of a mortgage.  According to government regulations, lenders are required to disclose the APR when they provide borrowers with a mortgage quote and the APR is supposed to enable borrowers to more easily compare mortgage proposals across multiple lenders.  Unfortunately, the feedback we hear from many borrowers is that APR is too complicated to calculate and understand so it comes as no surprise that they focus on mortgage rate instead of APR when they select lenders.


With 14% of responses, “Lowest Payment” barely trailed APR and was the third-ranked response in the survey.  Borrowers looking to stretch their monthly budgets are often highly focused on finding the mortgage with the lowest monthly payment.  Your mortgage payment is directly related to your interest rate (the number one response in our survey) but is also impacted by mortgage program and loan term.  The survey findings suggest that borrowers may be interested in adjustable rate mortgages (ARMs) that offer a lower initial interest rate and monthly payment.


Moving past the top three survey results, the bottom half of the survey is perhaps equally informative as the top half.  Qualitative factors such as recommendation and customer service lag more quantitative decision-making criteria such as interest rate.  Only 9% of borrowers selected “Recommendation” as the most important factor when they selected a mortgage lender and only 7% of borrowers chose “Customer Service.”  The survey findings imply that borrowers are willing to tolerate mediocre customer service to get a lower mortgage rate.  Of course a low interest rate combined with excellent customer service is the ideal option but it is interesting to understand borrower priorities.


Finally, coming in at sixth place in our survey, only 4% of borrowers selected “Lowest Closing Costs” as the most important lender selection factor.  This result demonstrates that borrowers may be willing to incur higher closing costs, such as paying discount points, to lower their mortgage rate and monthly payment.  Additionally, lenders that offer mortgage options with a range of interest rates and closing costs are more likely to meet borrowers’ needs.


As much as the mortgage process has evolved over the past decade with new regulations, technologies and lenders, the FREEandCLEAR Mortgage Survey shows that not much has really changed when borrowers select a mortgage lender.  While lenders attempt to entice borrowers with greater speed and functionality and borrowers have more ways than ever to search for, compare and evaluate lenders, the mortgage selection process always comes down to one number: your mortgage rate.


We will continue to provide a detailed analysis of each survey question on our blog in the coming weeks and you can review the full results from the FREEandCLEAR Mortgage Survey to better understand how borrowers think about and experience the mortgage process.

Borrowers Continue to Turn to Big Banks When Shopping for a Mortgage

Big banks may be losing share of the mortgage market but they continue to hold mindshare when borrowers shop for mortgages.  While specialized mortgage banks have experienced significant growth over the past several years, most mortgage borrowers still turn to big banks when they compare lenders according to the FREEandCLEAR Mortgage Survey.


When asked “what type of lenders did you contact when you got your mortgage (select all that apply)?”, 50% of borrowers selected “Big Bank”, which ranked as the top survey response.  Given the tarnished reputation of big banks as well as recent scandals, we were somewhat surprised that borrowers selected big bank more than any other type of lender.  The high ranking for big banks is likely attributable to borrowers having existing checking or savings account relationships with the banks as well as borrowers wanting to get a mortgage quote from a known brand.


types of lenders for mortgage

Types of lenders borrowers contact for a mortgage


The surprising results extended beyond the top of the survey as smaller, local lenders placed relatively high.  “Local Bank” and “Mortgage Broker” tied for the second highest response, with each type of lender garnering 38% of borrower responses.  Industry regulations implemented since the mortgage crisis have made business more challenging for both smaller lenders and mortgage brokers but they continue to be an important resource for borrowers and more importantly, a viable lending option.  The results of the FREEandCLEAR Mortgage Survey suggest that borrowers like having multiple lender choices — both big and small — when they shop for a mortgage.


The bottom results of the survey are also highly informative with “Credit Union” and “Mortgage Bank” ranking fourth and fifth, respectively.  28% of borrowers said that they contacted a credit union when they got a mortgage, which is roughly consistent with credit unions’ share of the overall mortgage market.  As credit unions continue to grow their membership bases and expand their mortgage lending options you would expect them to increase their borrower mindshare in the future.


Perhaps the most surprising finding from the survey is that only 23% of borrowers said that they contacted a “Mortgage Bank” when they got a mortgage.  Mortgage banks that focus exclusively on mortgages without taking borrower deposits or offering other lending products have gained significant market share over the past half decade.  Despite their strong growth, mortgage bank attracted the lowest response rate among surveyed borrowers.  There are several possible explanations for why mortgage bank ranked so low.  First, because the definition of a mortgage bank is relatively technical, borrowers may not differentiate between a mortgage bank and other types of lenders when they shopped for their loan.  We hypothesize that a higher percentage of borrowers contacted mortgage banks without actually realizing the lender was a mortgage bank.


The second factor that contributed to the disconnect is that while fewer borrowers may shop mortgage banks, more borrowers may select them for their loan.  For example, a borrower may not contact multiple lenders before deciding to use a mortgage bank for their loan.  Larger mortgage banks tend to advertise heavily which may attract more customers directly.  While FREEandCLEAR advocates that borrowers always shop multiple lenders for a mortgage, some borrowers may be persuaded by a lender’s marketing messages.  Whatever the reason, we expect mortgage banks to attract a greater share of mortgage shoppers in the future.


While the mortgage lender landscape continues to shift, the results of the FREEandCLEAR Mortgage Survey reinforce how important options are for borrowers.  Whether borrowers contact old school big banks, local banks or mortgage banks, the ability to shop multiple types of lenders remains key to borrowers finding the mortgage that is right for them.


We will continue to provide a detailed analysis of each survey question on our blog in the coming weeks and you can review the full results from the FREEandCLEAR Mortgage Survey to better understand how borrowers think about and experience the mortgage process.

New Mortgage Guidelines Help Buyers Afford More Home

Recently, Fannie Mae, the government-sponsored enterprise that helps to determine mortgage guidelines, increased the debt-to-income ratio that lenders use to determine what size mortgage borrowers qualify for.  You may not have heard of Fannie Mae because it is not an actual lender but it plays a very important role in the mortgage process.  Fannie Mae buys mortgages from lenders which in turn enables them to issue more mortgages to borrowers.  Fannie Mae is the largest purchaser of mortgages in the country so when it changes a rule or regulation the impact on the mortgage market — including both lenders and borrowers — is significant.


Fannie Mae’s decision to increase the borrower debt-to-income ratio is one of the most important mortgage guideline changes in years because it directly affects how much mortgage borrowers can afford. A debt-to-income ratio represents what percentage of your monthly gross income you spend on debt expenses including your mortgage payment, property tax, homeowners insurance and homeowners association fees (if applicable) as well as other debt payments such as for credit card, auto and student loans plus alimony, spousal or child support payments, if applicable.  In short, if you add up all your monthly housing and non-housing related debt payments and divide that figure by your monthly gross income, the result is your debt-to-income ratio.


The previous Fannie Mae guideline permitted a debt-to-income ratio of 43%, which meant that borrowers could spend a maximum of 43% of their monthly gross income on total monthly debt payments, including total monthly housing expense.  The new Fannie Mae guideline increases the debt-to-income ratio to 50%, which means borrowers are permitted to spend 50% of their monthly gross income on total monthly debt payments.  The increase is important because the higher the debt-to-income ratio, the higher the mortgage amount you can qualify for.


The change in debt-to-income ratio from 43% to 50% significantly increases the mortgage amount borrowers can afford according to Fannie Mae rules.  The example below compares what size mortgage a borrower can afford under the new 50% debt-to-income ratio as compared to the old 43% debt-to-income ratio.  In this example, the borrower makes $5,000 in monthly gross income and has $500 in monthly non-housing related debt payments (such as credit card and auto loan payments).  As illustrated by the example, under the new guideline, the borrower can afford a mortgage of approximately $342,900, as compare to a mortgage of $282,900 under the old guideline, an increase of $60,000, or 21%.  Please note that this example makes an assumption for property tax and insurance which vary by county and other factors, but the outcome generally remains the same across all borrower scenarios.          


   Old Ratio

(43%)

   New Ratio

(50%)

Monthly Gross Income

$5,000

$5,000

Monthly Debt

$500

$500

Estimated Monthly Housing Expense Plus Total Monthly Debt

$2,150

$2,500

Estimated Monthly Housing Expense

$1,650

$2,000

Estimated Monthly Mortgage Payment (P&I)

$1,310

$1,590

Estimated Mortgage Amount for Which You Qualify

$282,900

$342,900


While this example represents only one case, it demonstrates how the new debt-to-income ratio enables borrowers to qualify for a significantly higher mortgage amount, which enables them to buy more home. Borrowers can use our Mortgage Qualification Calculator to determine what size mortgage they can afford based on the new debt-to-income ratio guideline and their specific financial profile


In this case, the borrower could potentially afford to spend $60,000 more on a home.  In other cases, borrowers who thought they could not afford to buy a home in a particular neighborhood may have new options.  And other buyers who thought they were priced out of buying a home altogether may now be able to afford a home.  In summary, the new debt-to-income ratio increases purchasing power and expands the pool of people who can afford to buy a home.


There are a couple of important points to keep in mind about the new debt-to-income ratio.  First, while Fannie Mae rules are guidelines, some lenders may impose stricter internal rules, called lender overlays, which means some lenders may not apply the higher debt-to-income ratio.  FREEandCLEAR surveyed multiple lenders, however, and they all indicated that they are using the higher ratio.


Second, the new guideline does not apply to all mortgage programs.  Government-backed mortgage programs such as the FHA, VA and USDA programs apply their own guidelines and typically use a lower debt-to-income ratio.  Additionally, some lenders may offer proprietary mortgage programs that use a lower or higher debt-to-income ratio.  Borrowers should understand up-front what debt-to-income ratio their lender uses as well as the income and debt inputs used to calculate the ratio.


Finally, while the new debt-to-income ratio enables borrowers to qualify for a higher loan amount, that does not always mean that is the right mortgage for you. The most important factor in deciding what size mortgage you can afford is that your are financially comfortable with your monthly mortgage payment and total monthly housing expense over the long term.  The worst outcome when you get a mortgage is that you end up with a monthly payment that you cannot afford.  Regardless of your debt-to-income ratio or what a lender tells you, it is ultimately up to you to choose a loan amount that you can afford.